A Tale of Project Build Time Improvement
Introduction
Build time is a key factor to engineers’ productivity. Slow build time can be frustrating and lead to hindered progress. There has been a great amount of effort by the community to tackle this complex problem. This blog post highlights various methodologies employed by our team (at Grab) to alleviate this pain point.
Background
The process of building an iOS project involves multiple steps, including compiling source code, processing resources (headers, assets, storyboards, etc.), linking binaries, and code signing. These build tasks, while parallelizable, are executed in dependency order.
Clean builds vs. incremental builds
- Clean build: This involves compiling the project from scratch. To trigger a clean build, you simply need to clean the derived data beforehand.
- Incremental build: An incremental build occurs when there’s cached data from the previous build. Only source code that have changed and its dependents need to be recompiled. This is usually the case for local development. While a clean build can take up to 20 minutes, incremental build times vary from seconds to minutes depending on the changes made.
On CI, we often care about clean builds because cached data between runs may not retain. Also, invalidated cache might result in unexpected build failures, causing frustrations for engineers.
In large-scale projects, the compilation times can range from 10 to 20 minutes, often viewed as a bottleneck affecting engineers’ productivity. In the following sections, we’ll explore several methods we’ve adopted to mitigate this challenge.
Methodologies
Tracking metrics
The journey to improving build times begins with understanding the current state. Measuring build times and consistently tracking this data is a prerequisite for evaluating any approach. If the average clean build time over a week is, for instance, 10 minutes, this becomes the baseline for improvement. The goal is to bring this number under 10 minutes. Failing to achieve this indicates an unsuccessful solution.
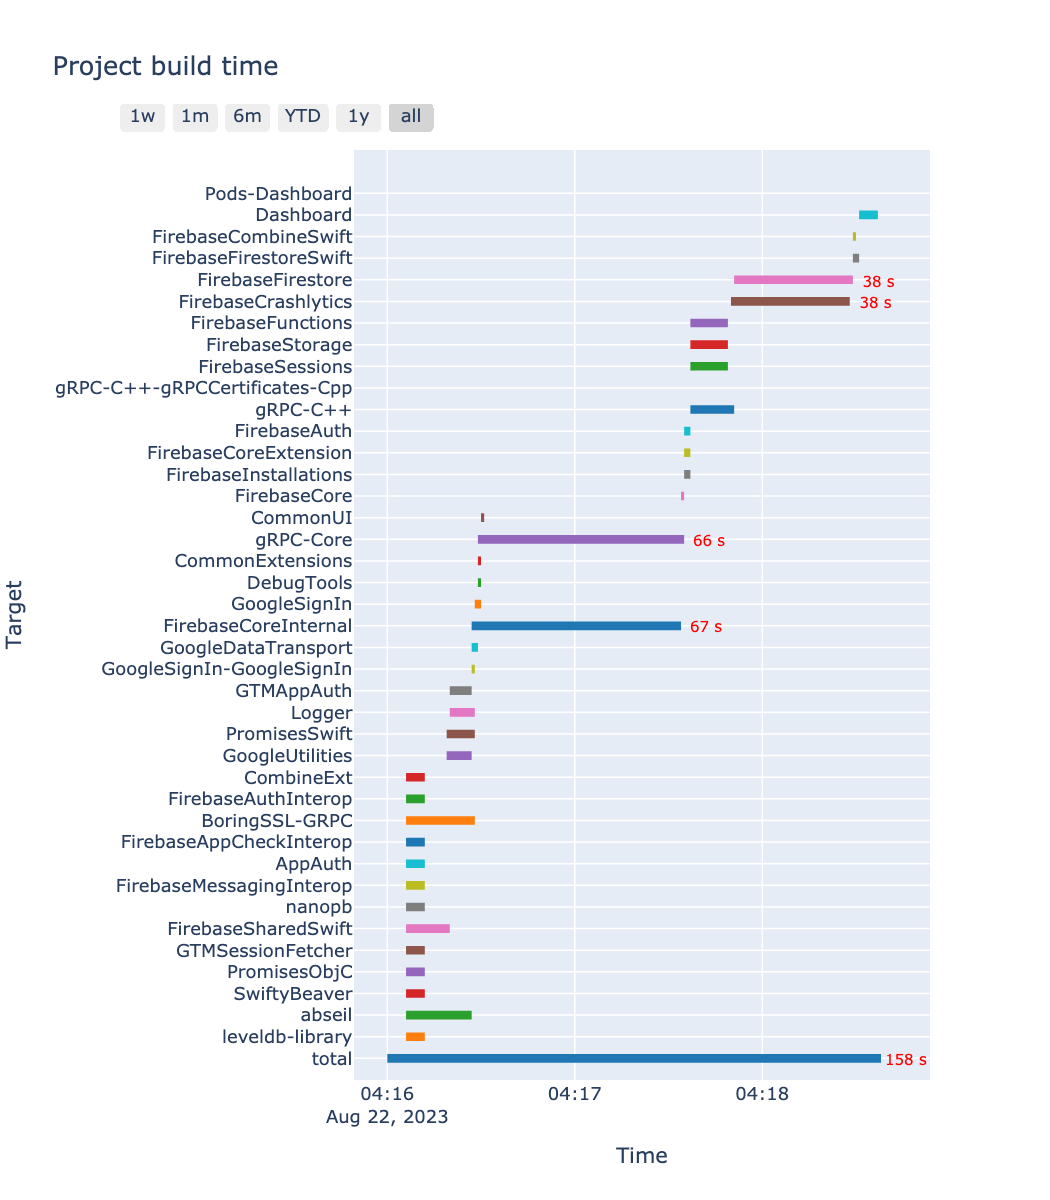
One way to measure build time is by timestamping the start and end of actions and calculating time differences. This can be done using Xcode’s pre-actions and post-actions support. Additionally, build times for specific targets can be measured by adding run scripts to their build phases. This data enables visualization of build time breakdowns, as shown in the example Gantt chart.
Note that scripts for per-target tracking are best suited for CI. Running these scripts for each target during incremental builds would be unnecessary.
Monitoring build time trends
Tracked data allows us to monitor trends over time. It’s essential to recognize that the total build time shouldn’t remain static. Rather, we might observe an upward trend as the project’s codebase grows. Because of this correlation, your engineering OKR shouldn’t merely focus on minimizing build time. Factors like code growth must also be considered. For instance, a 20% increase in code size (calculating by the number of lines) could lead to a predicted 12-minute build time (ie. additional 2 minutes in build time). Thus, maintaining a consistent 10-minute build time would already be a significant challenge. This example highlights the importance of tracking not only build time but also factors influencing it.
CI build time vs. local build time
Data should be collected from both CI builds and local development builds. While CI build time represents clean builds, local build time reflects incremental builds, varying from seconds to minutes. Therefore, distinguishing between these sources is crucial. Moreover, for noisy data like local build time, percentile (p50, p90) may offer more reliable insights than raw averages.
Increasing the sample size
Build time data can fluctuate due to various reasons. Triggering more builds ensures representative data. In our project, we scheduled hourly jobs solely for metrics collection. This approach smoothed out data noise, providing a more accurate representation.
Gaining insights from tracking metrics
Once data is collected, we can do some exploratory data analysis (EDA) to gain insights.
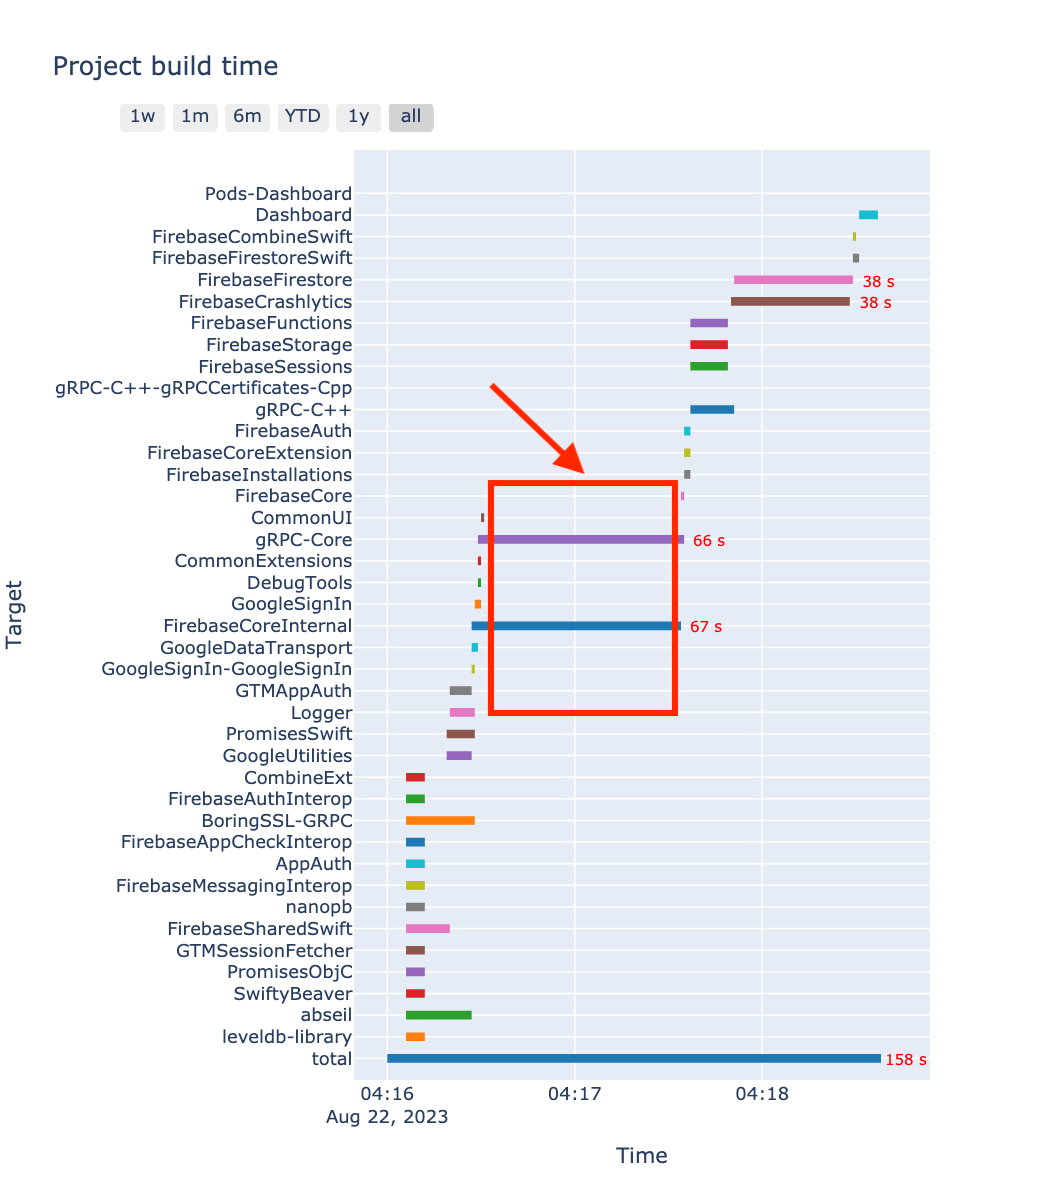
In the gantt chart earlier, there’s a period where Xcode’s build parallelism was under-utilized. During that time, only 2 targets were compiled despite Xcode’s capability to handle up to 10 parallel build processes. This bottleneck suggests ineffective dependency management that fails to leverage parallelism.
Modularization
Modularizing code into smaller modules, often called pods in CocoaPods’s terms, can improve incremental build times. In our project, we organized code based on functionality, with each app function belonging to a tech family (ex. FoodModule in the Deliveries team). This way of structuring code also helps clarify code ownership.
Analyzing dependencies
While establishing module dependencies is convenient, we need to be mindful of their impact on build time. Here’s an example of a poor dependency structure.
We had a Logger module dedicated to logging. This core module was heavily relied upon by other modules. It also depended on a third-party logging framework CocoaLumberjack.
part from logging, the Logger had an additional functionality. It processed error logs and uploaded them to Firebase Crashlytics for tracking purpose. Initially, Logger depended on FirebaseCrashlytics for this purpose, which proved to be problematic
The Gantt chart revealed that many targets should have compiled earlier, but they waited for Logger. Many dependencies needed to be compiled just for FirebaseCrashlytics. Let say it takes 20 seconds to build this pod and its dependencies. Then, the compilation of its dependents (which are more than 80 pods) is delayed by at least 20 seconds.
We removed this unhealthy dependency. To maintain the recording error behavior, we kept the interface of the error recorder in Logger and moved its implementation (which required FirebaseCrashlytics) to the main target.
// Module: Logger
protocol ErrorRecorder {
  func record(error: Error)
}
// Main target
import FirebaseCrashlytics

final class CrashlyticsErrorRecorder {
  func record(error: Error) {
    Crashlytics.crashlytics().record(error: error)
  }
}
Module interface and module implementation
The above example highlights a slow build case where a module’s interface and implementation reside together.
In fact, dependents only require access to interfaces, not implementations. Interfaces are lightweight declarations, while implementations involve more code to connect components.
In our project, we had a History module depending on a complex module called JobFlow. This module contained logic related to drivers’ job flow (from receiving a job til finishing that job). As one of the most complicated components in the project, its compilation was usually slow.
To accelerate compilation, we can split JobFlow into two parts:
- JobFlowInterface: Contains only interfaces and data models, with just a few Swift files. Rarely changes due to internal logic. Such logic are implementation related.
- JobFlowImpl: Implements JobFlowInterface.
The dependencies are now structured as follows:
main target -> History     -> JobFlowInterface
main target -> JobFlowImpl -> JobFlowInterface
If we take further effort to split History into its interface and implementation components, then the dependencies look like this:
main target -> HistoryImpl -> HistoryInterface -> JobFlowInterface
main target -> JobFlowImpl -> JobFlowInterface
This dependencies model helped kick-start the compilation of interface and implementation modules earlier, hence, utilize Xcode’s build parallelism.
Note that, an interface module should never depend on an implementation module. Based on the naming, we can write a linter to ensure this principle. It is acceptable that an implementation module depends on another implementation module. However, the Implementation -> Interface dependency should be prioritized first.
Non-host test targets
Initially, we had a single test target (UnitTests) for unit tests. This target was a host-app test target because some tests were written to cover logic of the main target. In other words, the UnitTests target depended on the main target. That means Xcode had to compile the main target prior to this test target. Therefore, in the build graph, the compilation of this target occurred at the very end. And once again, the build parallelism during this period was not utilized.
The compilation order was as follows:
                         UnitTests
                         |
               main target
               |
... dependency A
... dependency B
... dependency C
Over time, UnitTests was getting bigger and bigger to the extent that its compilation time was even more than the main target’s.
Seeing this bottleneck, we split UnitTests into smaller non-host test targets. Each covered logic of a tech family’s code. We also migrated app logic from UnitTests to these new targets. Of course UnitTests still retained to test logic that couldn’t be migrated.
The compilation order then became like this:
                         UnitTests
                         |
               main target
               |
               TechFamily_X_UnitTests
               |
               TechFamily_Y_UnitTests
               |
... dependency A
... dependency B
... dependency C
Fine-tuning build settings
Optimizing build settings is another common approach alongside modularization. Specific build settings impact different aspects of the build process. Fine-tuning them can yield performance improvements.
Following are some general recommendations in this regards.
DEBUG_INFORMATION_FORMAT
- Set as
dwarffor Debug because dSYM generation is an overhead cost and often unnecessary during local development.
GCC_GENERATE_DEBUGGING_SYMBOLS
- Set as
NOif debugging symbols aren’t required, especially for CI runs.
SWIFT_COMPILATION_MODE
- Use
singlefile(incremental) for Debug builds andwholemodule(whole module) for Release builds. - In theory,
wholemoduleenables the compiler to perform a big part of the compilation work in parallel (for details, refer to https://www.swift.org/blog/whole-module-optimizations/#compile-time). Meanwhile,singlefileis preferrable for incremental builds. Therefore, our setup was:- For CI, set as
wholemodulebecause all builds were not incremental. - For Release (or any non-Debug) builds, default to
wholemodulebecause of the same reason as above. - For Debug builds (on local), use
wholemodulefor 3rd-party pods because those pods were not meant for local changes. The rest, including development pods, the main target, and test targets, had this setting assinglefileto benefit from incremental builds.
- For CI, set as
SWIFT_OPTIMIZATION_LEVEL and GCC_OPTIMIZATION_LEVEL
- Set as
-Ononeand-O0respectively for Debug builds to skip code optimization as it required the compiler to do more work. Note thatSWIFT_OPTIMIZATION_LEVELis for Swift compilation whileGCC_OPTIMIZATION_LEVELis for C/C++/Objective-C/Objective-C++ code compilation.
For the extensive list of build settings, refer to this documentation: https://developer.apple.com/documentation/xcode/build-settings-reference.
A/B testing to figure out the optimal settings
While some theoretical settings sound promising, their practical results may differ.
Take SWIFT_COMPILATION_MODE=wholemodule for example. If the project has only a few targets, this setup helps reduce build time significantly. However, our project has more than 80 pods, the wholemodule compilation is also constrained by the parallel-targets build.
Moreover, there are a number of settings that can impact build time. For example, STRIP_SWIFT_SYMBOLS is a setting to control whether to strip Swift symbols after linking products. And our hypothesis was: the lesser work, the faster build time. Was this hypothesis correct and how much reduction we could have? We conducted A/B tests to verify those kinds of hypotheses.
We planned to run many control-treatment experiments. In each experiment:
- The control group: Was the project without any build settings update.
- The treatment group: Was the project with an update in a given build setting. The update applied to all targets. This was done by interfering in the post_install hooks during the pod installation. The value was handily injected by an environment prefixed with
AB_TESTING. For example, when there existed a variableAB_GCC_OPTIMIZATION_LEVEL=-O, the value ofGCC_OPTIMIZATION_LEVELwas forced-update to-O. - The control and treatment groups were ensured to run against the same commit, on the same hardware specs to eliminate all the confounding factors.
We ran concurrent experiments multiple times over a few days to make sure the collected data were representative enough. As data collection was already integrated, our remaining work was just to plot data into charts and wait for the results.
With the A/B testing setup, we happened to figure out some surprising facts. For instance, SWIFT_OPTIMIZATION_LEVEL=wholemodule might display an inverse effect in a project that has lots of dependencies.
Thus, my recommendation is to establish the A/B testing experiments to figure out the optimal build settings (in practice) on your own. Do not take build settings advices for granted.
Identifying top slow-compiled code snippets
Micro-level optimizations matter too. Identifying and addressing slow-compiled code snippets can yield unexpected improvements. We found that seemingly simple code expressions, like RxSwift chaining and combined expressions, could drastically slow down compilation times. Surprisingly, some 3-chain expressions (foo.map { }.map { }.map { }) even took more time than a 5-chain one.
The diagnostic of function/body compilation times can be done with the two frontend flags:
-Xfrontend -warn-long-function-bodies=<limit>-Xfrontend -warn-long-expression-type-checking=<limit>
To automate this diagnostic, we scheduled daily jobs to build the project with those flags. We parsed the xcodebuild logs to extract expression compilation time. The top slow-compiled code were automatically alerted to the team for visibility.
Note that with those frontend flags on, the overall build time is expected to be longer than usual. Thus, metrics submitted by these dedicated jobs should have dedicated tags so that they would not mess up our build time data.
Using cocoapods-binary-cache
In late 2019, we initiated an idea to improve build time by caching frameworks for CocoaPods-based projects. We developed the MVP and open-sourced the project at https://github.com/grab/cocoapods-binary-cache.
This plugin integrates prebuilt frameworks during CocoaPods installation, bypassing the need to compile certain pods from source. The following figure captures how the Xcode project looks like after integrating the prebuilt frameworks.
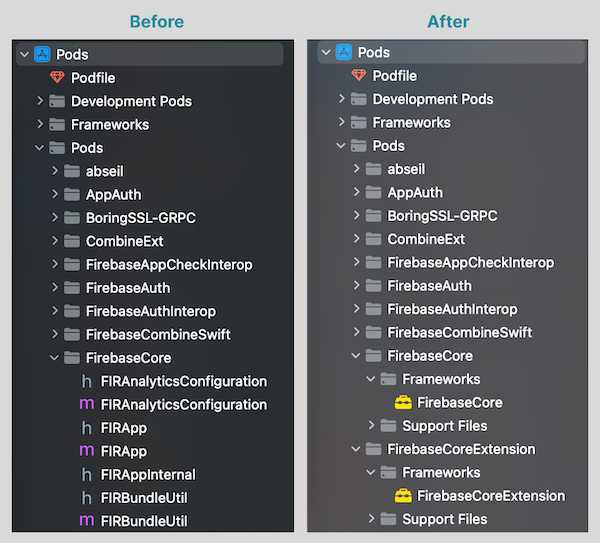
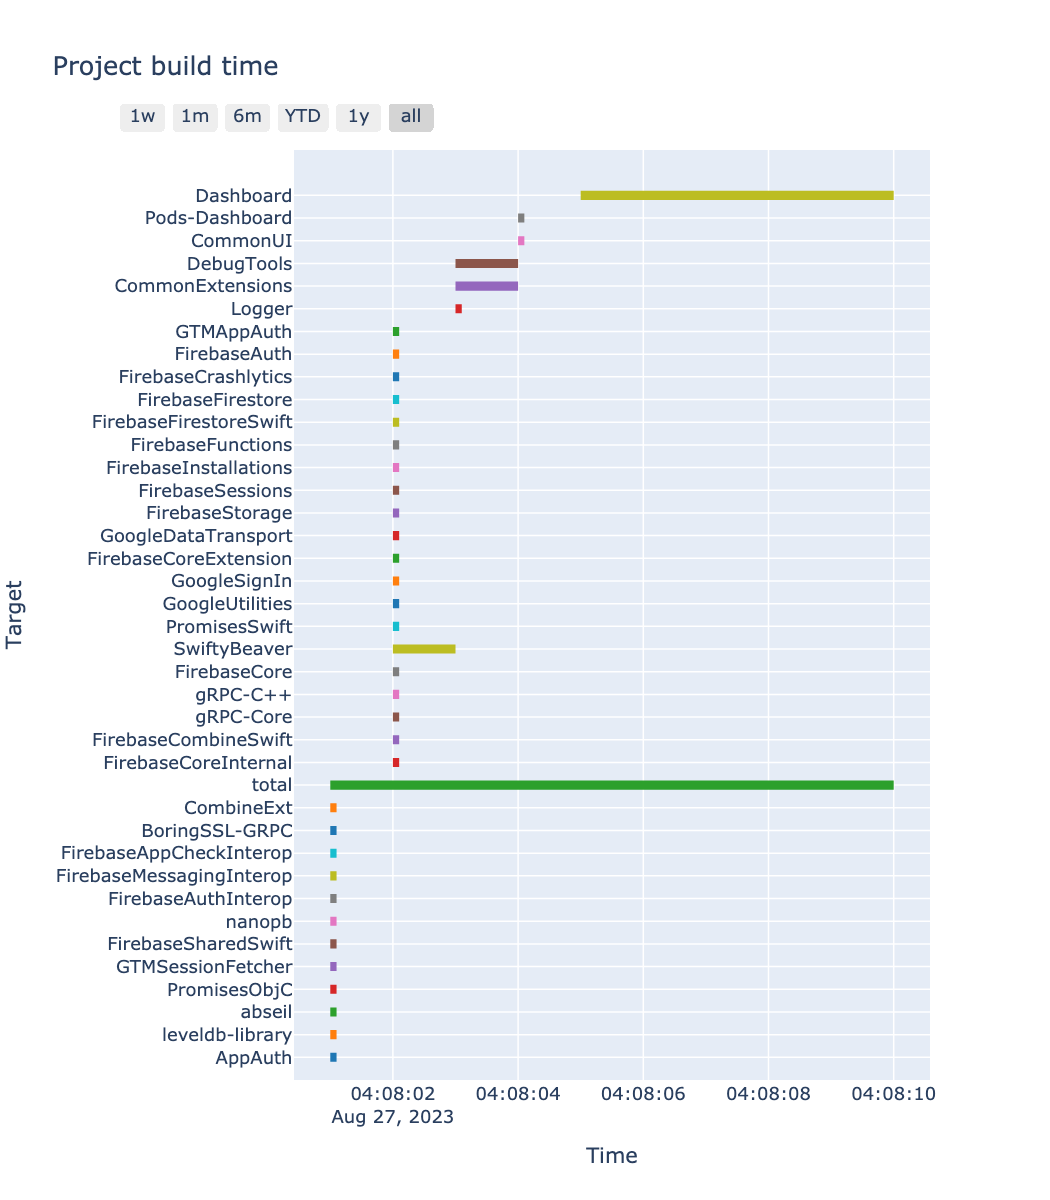
This idea gave rise to a significant improvement in project build time.
At first, we adopted this solution for 3rd-party pods only. Meanwhile, development pods were integrated using source code as usual. Given a large number of 3rd-party pods in the project, the reduction was recorded to be up to 7 minutes. This was translated to roughly 30% improvement. As we rarely updated 3rd party pods, the cache hit rate stayed high which resulted in a consistent improvement.
After seeing the success for the adoption on CI, we continued rolling out the solution for local development. We used separate cache for CI and local builds because:
- For local environment, we needed to support both architectures (x86_64 for simulators and arm64 for devices).
- For CI, we only need x86_64 cache to shorten the cache deployment cycle.
After that, we focused on enhancing the plugin to handle development pods. The rollout on CI also displayed a remarkable result. However, maintaining a high cache hit rate was a challenge.
First, if an engineer makes a change in a module, the cache for that module is invalidated. The cache invalidation also occurs in its dependents. If such a change takes place in a core module, the cache hit rate would not be high. In fact, we saw this very often. In our project, there are some tech-family-related pods for resources (ex. DeliveriesResources, PaymentResources). We used RSwift to generate strong-typed resources (strings, images, etc.). Many business-logic modules depend on resources modules, for access to their strings and icons. As a consequence, whenever an engineer updated localizations or assets, the cache hit rate fell low.
DeliveriesModule → CommonResources
                 → DeliveriesResources
The challenge above can be solved by having multiple cache versions. For example, having up to 3 cache versions for a pod can help increase cache hit rate. However, this multi-versions caching feature has not been yet supported by the plugin.
It is worth a mention that we only applied prebuilt frameworks for development pods on CI. This was because on local, we make changes on a regular basis. If integrating a development pod as a prebuilt framework, we loose the ability to debug and make changes within that module. The developer experience then will be compromised. We did not spend further effort in solving this pain point.
Adopting a different build system
Another experimental initiative was adopting a different build system. While Xcode/xcodebuild provided good developer experiences, another build system could offer better building capabilities. At that time, another mobile team in the company spent quite some effort in Bazel, a multilingual build system developed by Google. There were two prominent benefits leading us to exploring this build system:
- Bazel was known for highly efficient and parallelized build processes.
- It supported remote caching which was a game changer for us. Compared to cocoapods-binary-cache, this would be a suitable solution to tackle build time on both CI and local.
However, there are some downsides if adopting Bazel:
- Learning curve: Engineers need to onboard with a whole new build system. They have to understand its concepts and know to to configure targets properly. The learning cost would be even more for new comers.
- Maintenance cost: With a new build system comes a great maintenance effort. It would be difficult for a team with inexperienced engineers to bear that cost.
- Developer experience: Without Xcode, engineers may find it difficult to finish their tasks without autocompletion and debugging capabilities.
We experimented two approaches:
- The pure Bazel approach: We used Bazel entirely for engineers’ workflows. With this approach, the developer experience was compromised. But we wished to estimate how much reduction we might get to see the whole picture first.
- The hybrid approach (Bazel + Xcode): We kept the current project structure with each pod target being built by Bazel. We assumed that engineers would still benefit from their familiar workflows with Xcode, hence, pave way for a smoother transition. However, by structuring code into pod targets, we limited the parallelism of Bazel build system.
The incipient evaluation showed that the downsides outweighed the benefits. Therefore, we did not spend much further effort in this Bazel initiative due to limited capacity.
Conclusion
In the fast-paced iOS development, improving project build time has been of paramount importance. Many approaches can be adopted to tackle this classic problem, from fine-tuning build settings to code modularization. Dependencies in multi-targets projects should be examined to utilize parallelism. Apart from adopting cocoapods-binary-cache for CocoaPods-based projects, engineers might consider alternative build systems for better build performance. However, we need to find the right balance between improved build times and developer experience because at the end of the day, the purpose of build time improvement is just to provider better developer experiences.
Resources
- Behind the scenes of the Xcode build process: https://suelan.github.io/2020/07/05/20200705Behind-the-Scenes-of-the-•Xcode-Build-Process
- Build settings reference: https://developer.apple.com/documentation/xcode/build-settings-reference
- Whole module optimization: https://www.swift.org/blog/whole-module-optimizations
- Improving the speed of incremental builds: https://developer.apple.com/documentation/xcode/improving-the-speed-of-incremental-builds
- Improving build efficiency with good coding practices: https://developer.apple.com/documentation/xcode/improving-build-efficiency-with-good-coding-practices
- Build performance analysis for speeding up Xcode builds: https://www.avanderlee.com/optimization/analysing-build-performance-xcode
- CocoaPods binary cache: https://github.com/grab/cocoapods-binary-cache